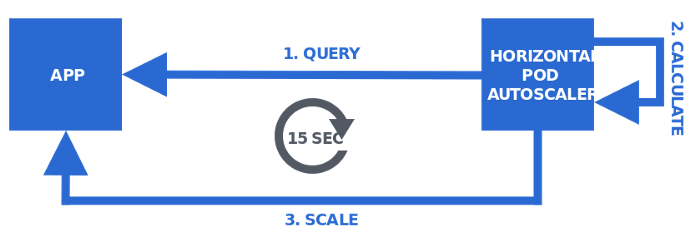
Như ta đã biết, Kubernetes sử dụng Horizontal Pod Autoscaler (HPA) để có thể scale số lượng pod.
Để có thể làm được điều đó, HPA sẽ thực hiện vòng loop để query những metrics hiện tại sau đó tính toán và thực viện công việc scale.
Nhưng có vấn đề đặt ra ở đây, đó là đôi khi những metrics thu về được lại chưa đủ để có thể thực hiện scale. Ví dụ sẽ được nói đến tiếp theo trong bài viết.
Để thực hiện điều này thì Kubernetes có thành phần được gọi metrics registry. Mục đích metrics registry là cung cấp giao diện để client có thể query metrics. Giao diện này gồm 3 thành phần là:
- Resource Metrics API
- Custom Metrics API
- External Metrics API
Vậy khi chúng ta muốn scale với Custom Metrics API, ta cần phải cung cấp backend cho nó. Backend này bao gồm 2 thành phần chính đó là Metric collector và Metric API server.
METRIC COLLECTOR
Chúng ta sẽ lựa chọn Metric collector khá phổ biến: Prometheus
Để cho đơn giản,ở đây ta sẽ sử dụng Prometheus-operator thông qua Helm:
Repo prometheus-operator:
https://github.com/helm/charts/tree/master/stable/prometheus-operator
Prometheus-operator gồm nhiều thành phần, trong đó chủ yếu là Prometheus, Grafana (công cụ tạo dashboard), và các service monitor để lấy metrics từ kubernetes.
Câu lệnh:
helm install my-mon stable/prometheus-operator -f values.yaml
Trong đó values.yaml là file mình tự tạo với nội dung như sau:
serviceMonitorSelectorNilUsesHelmValues: false [1]
Việc này là cần thiết vì nó sẽ cho phép thu được những metrics khác ngoài những thành phần của Kubernetes.
Sau khi thực hiện xong, ta hoàn toàn có thể truy cập trang web đã được host lên:
Prometheus:

Grafana:
MQTT BROKER (VerneMQ)
Ta sẽ sử dụng VerneMQ làm MQTT Broker làm ví dụ
Tiếp tục sử dụng Helm để tải VerneMQ
Repo:
https://vernemq.github.io/docker-vernemqTa cần phải cấu hình VerneMQ 1 chút mới có thể chạy được không như Prometheus-operator.
Đầu tiên, ta cần pull verneMQ chart về:
helm pull vernemq/vernemq --untar true
Ta sẽ pull Chart về và giải nén, ta có thư mục vernemq
Truy cập file values.yaml trong thư mục, ta chỉnh sửa 1 số thông số như sau
Quan trọng
Vì helm sử dụng image 1.10.2 để tạo vernemq và image này bị lỗi thiếu thư viện, ta cần chỉnh config
image: 1.10.2 thành image: 1.10.2-1-alpine hoặc image: lastest để không gặp lỗi này
Sau đó:
serviceMonitor:
  create: true
Tạo ra service monitor để prometheus lấy được những metrics
Đồng thời ta cần phải thêm vào:
additionalEnv:
  - name: DOCKER_VERNEMQ_ALLOW_ANONYMOUS
    value: "on"
  - name: DOCKER_VERNEMQ_ACCEPT_EULA
    value: "yes"
  - name: DOCKER_VERNEMQ_ALLOW_ANONYMOUS
    value: "on"
Để bỏ qua bước xác thực khi truyền tin
  - name: DOCKER_VERNEMQ_ACCEPT_EULA
    value: "yes"
Chấp nhận điều khoản sử dụng của VerneMQ [2]
Ngoài ra, VerneMQ còn là 1 Stateful Cluster thế nên ta cần phải lệnh gọi để tách node khỏi cluster khi scale down.
Trong thư mục templates, ta truy cập file statefulset.yaml thêm nội dung:
lifecycle:
            preStop:
              exec:
                command: ["/bin/bash","-c","vmq-admin cluster leave node=VerneMQ@$HOSTNAME.myvernemq-headless.default.svc.cluster.local -k -i 1 -t 30"]
Sau khi cấu hình xong, ta sử dụng helm để triển khai:
helm install myVerneMQ . --set replicaCount=2 -f values.yaml
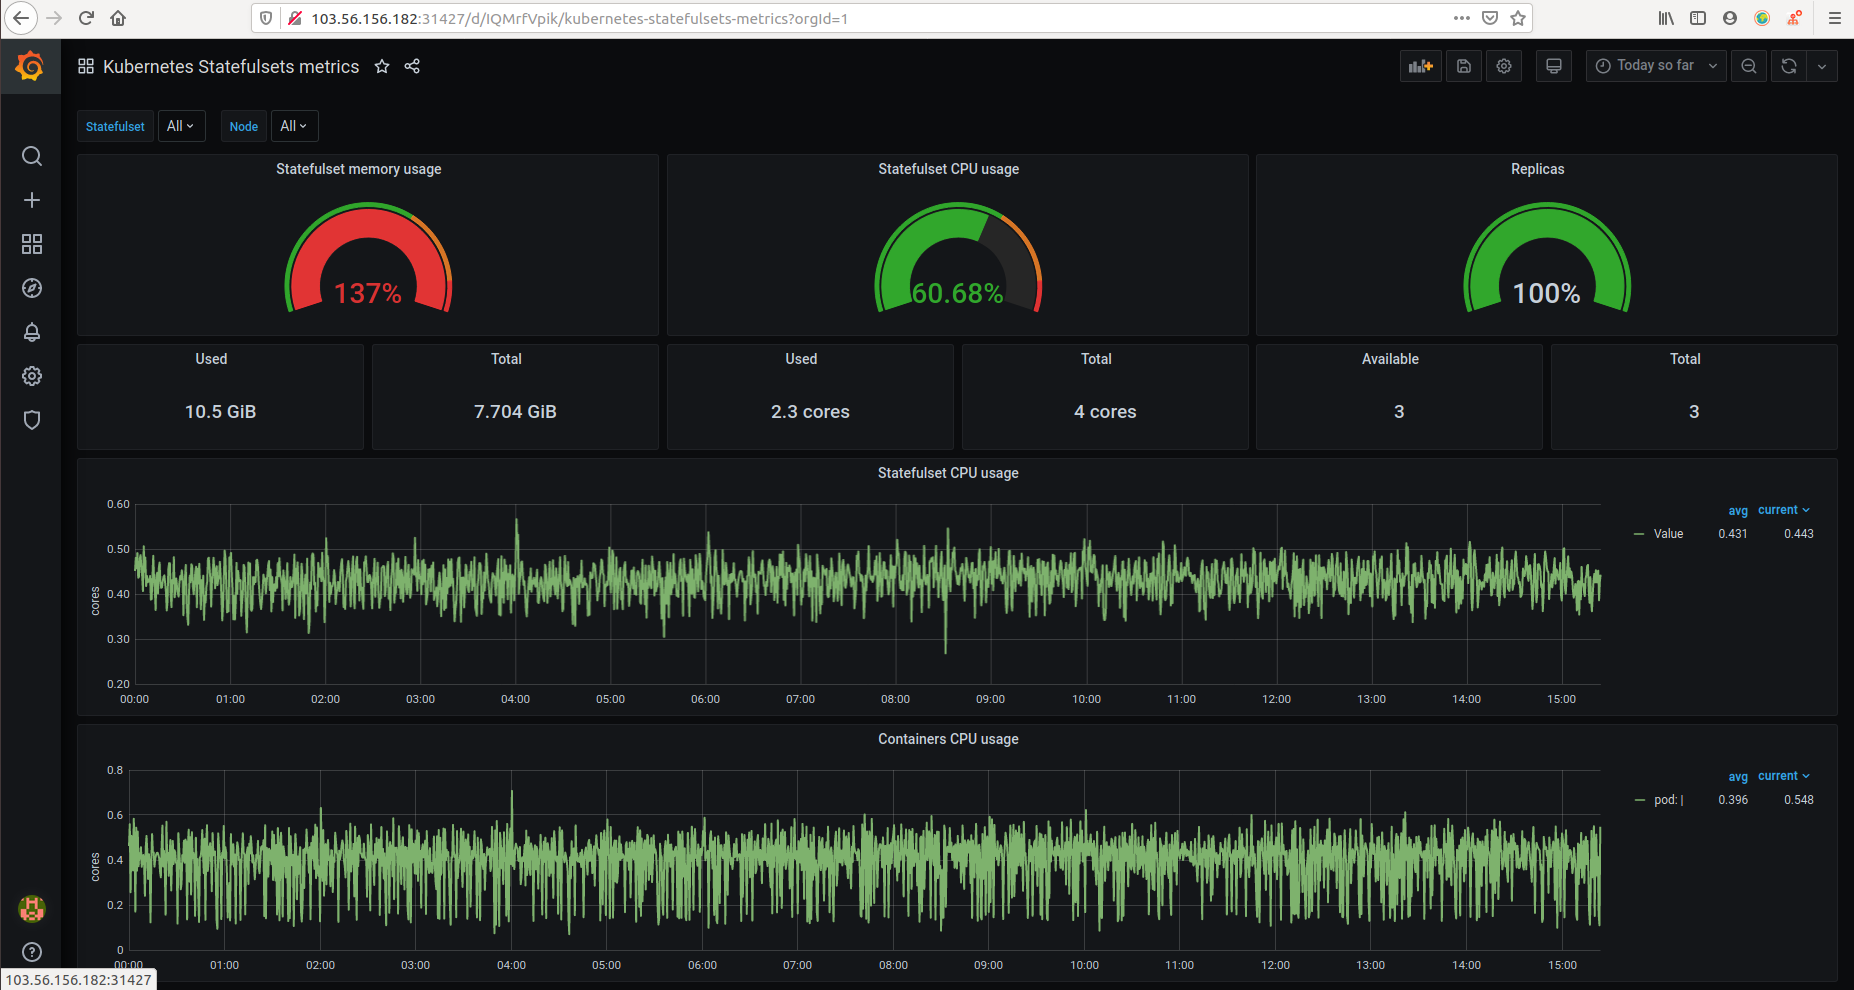
Sau khi triển khai xong, thì Prometheus cũng có thể lấy được metrics từ VerneMQ (VerneMQ có exporter mặc định khi được tạo ở port 8888) [3]
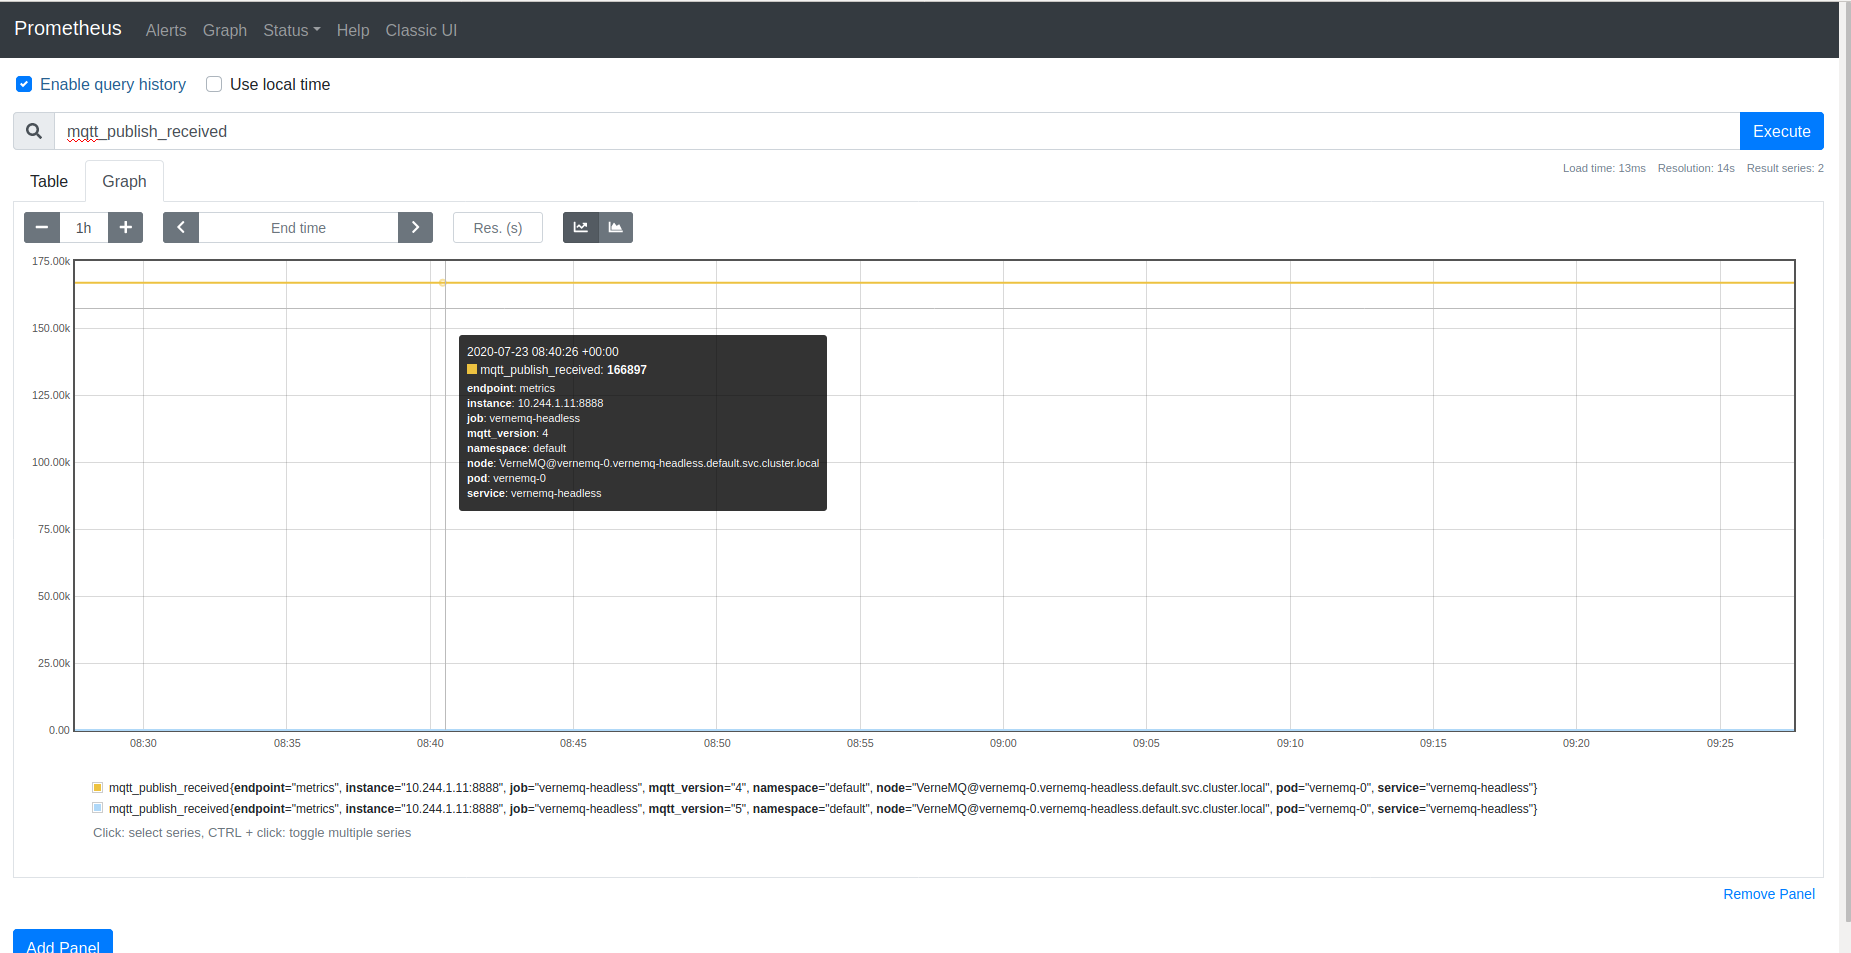
Để kiểm tra hoạt động monitor đúng, ta sẽ thử publish message đến
Ở đây ta sẽ sử dụng Python và thư viện paho-mqtt
 PyPI
PyPI
Code python:
import paho.mqtt.client as paho
import timebroker="localhost"
port=1883def on_publish(client,userdata,mid):             #create function for callback
    print("Published message to topic","ecg/omniacare/devices")
    print("mid=", mid)
    passclient1 = paho.Client("control1")                           #create client objectclient1.on_publish = on_publish                          #assign function to callbackff = open("/home/mqtt_ecg.txt","r")
ss = ff.read()

x = 3000
while True:
    x += 1
    client1.connect(broker,port) #establish connection
    client1.loop_start() #start the loop
    ss2 = ss.replace("mario.rossi", "mario.rossi."+str(x).zfill(6))
    print("Publishing message to topic","ecg/omniacare/devices")
    res = client1.publish("/ecg/omniacare/devices/0X345000DFG",ss2,2,0)
    print("Post publishing message to topic","ecg/omniacare/devices",res)
    client1.loop_stop(force=True)
    client1.disconnect()
    time.sleep(5) # wait
time.sleep(5) để điều khiển tần suất bắn message
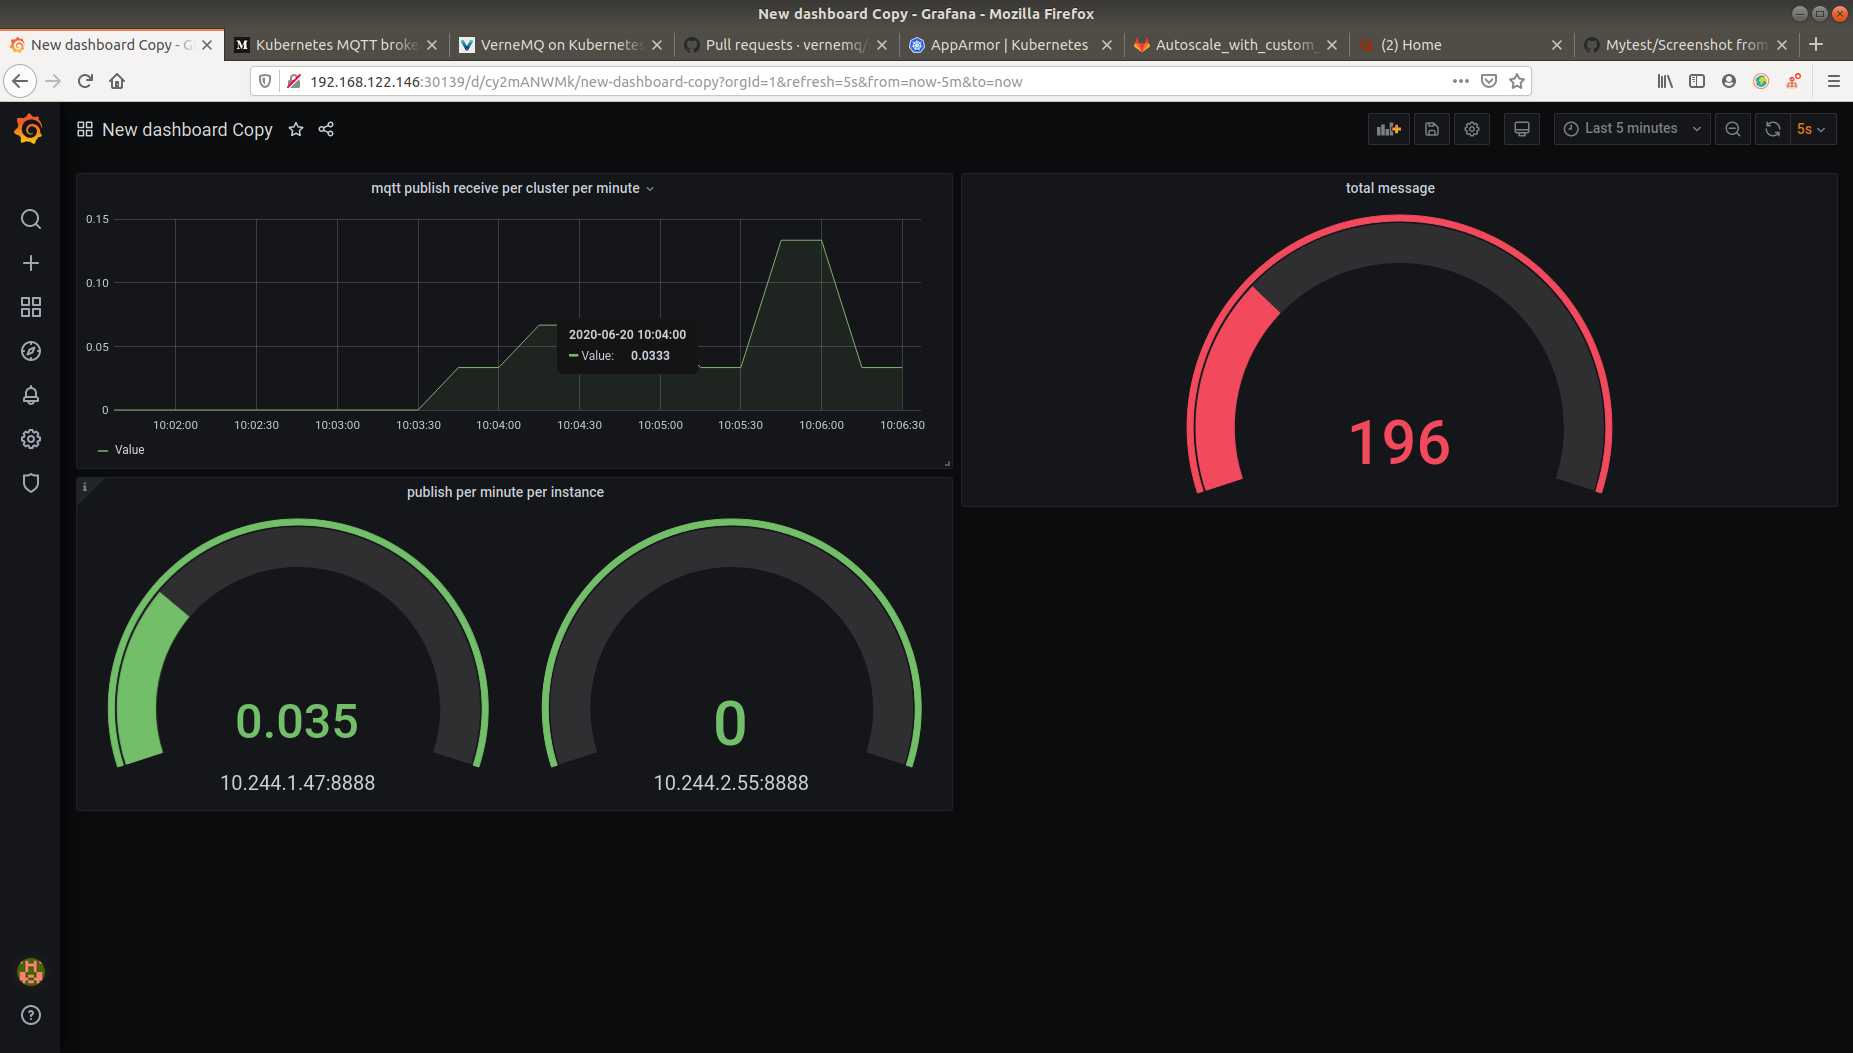
Ta sẽ tạo dashboard sử dụng grafana
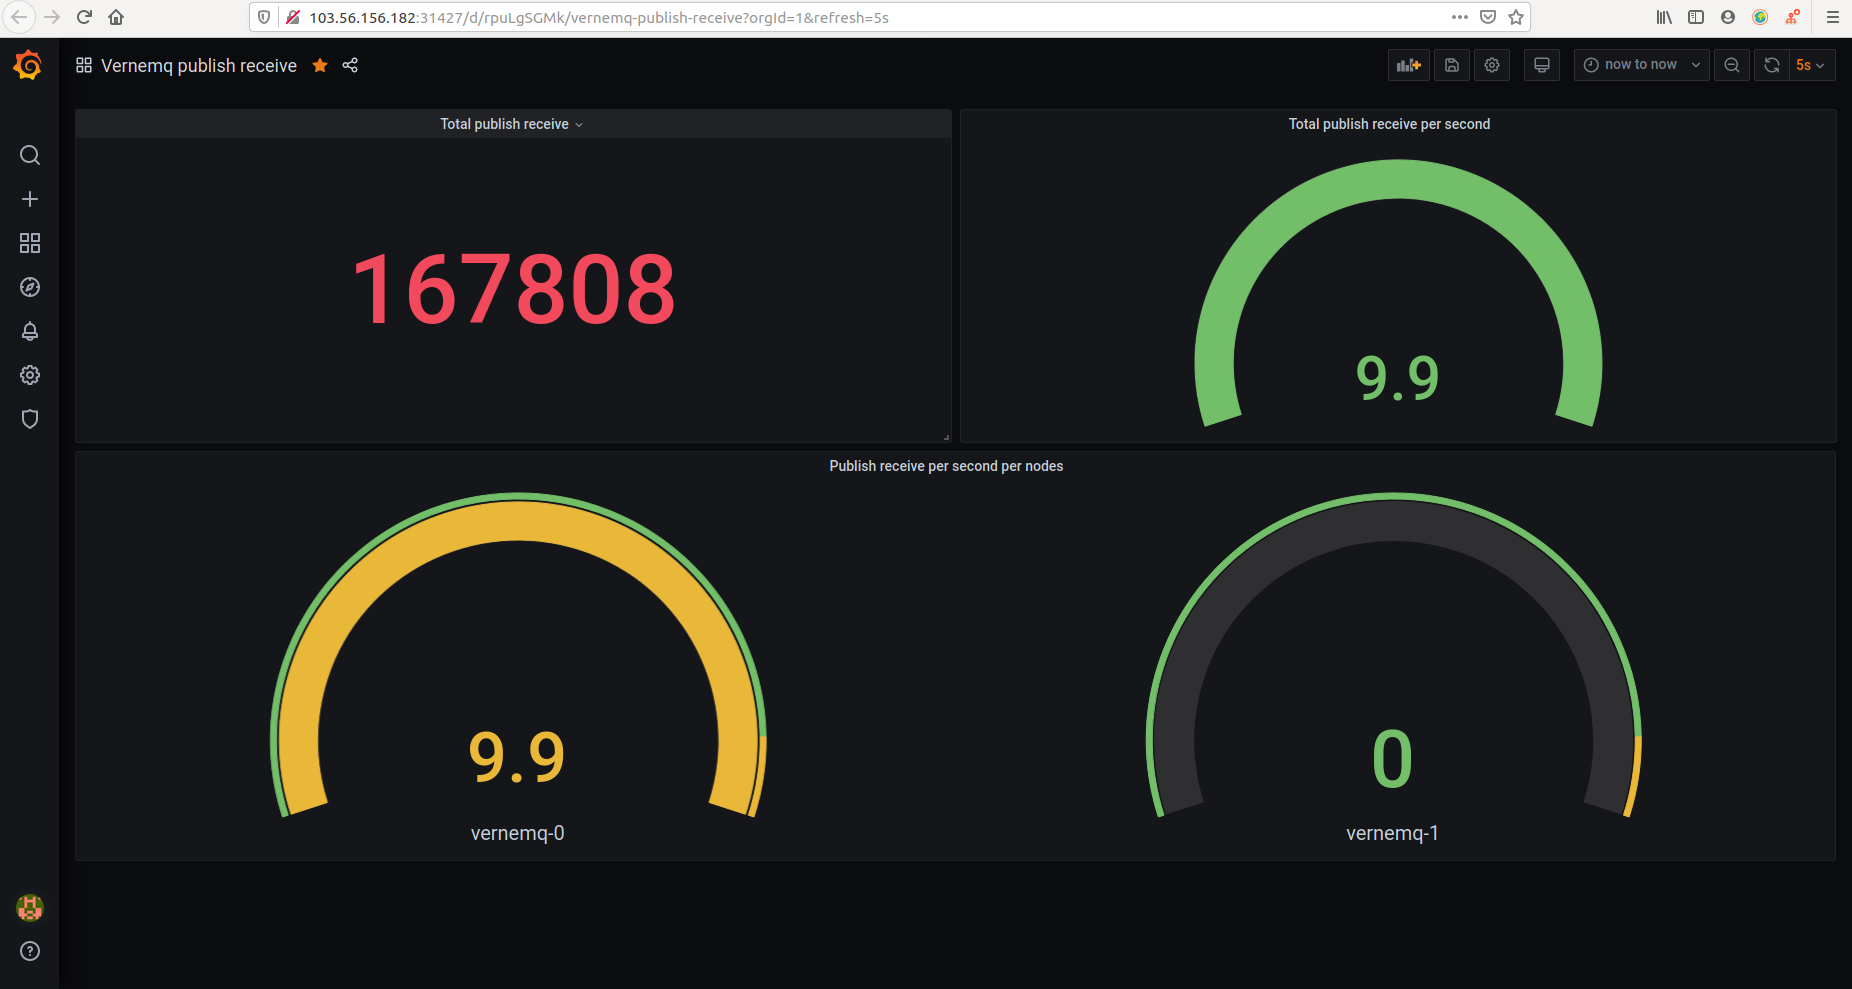
Trong đó:
Total publish receive: sum(mqtt_publish_received)
Total publish receive per second: sum(irate(mqtt_publish_received{mqtt_version="4"}[1m]))
Publish receiver per second per node:
irate(mqtt_publish_received{mqtt_version="4"}[1m])
Ở đây, ta muốn cho VerneMQ scale theo số lượng message publish mỗi giây, nhưng lại không có metrics nào đáp ứng được nhu cầu của chúng ta cả.
Và như đã nói ở trên, chúng ta cần Metric collector và Metric API server, ta sẽ cần Metric API server. Ở đây chúng ta sử dụng Prometheus-adapter
METRIC API SERVER
repo :
https://github.com/helm/charts/tree/master/stable/prometheus-adapter
Tương tự như VerneMQ, ta cũng cần pull về cấu hình 1 số chỗ
Trong file values.yaml
# Url to access prometheus
prometheus:
  url: http://my-mon-prometheus-operator-prometheus.default.svc.cluster.local
  port: 9090
Ta trỏ đến prometheus operator
rules:
    - seriesQuery:
    '{namespace!="",__name__="mqtt_publish_received",mqtt_version="4"}'
      seriesFilters: []
      resources:
        template: <<.Resource>>
      metricsQuery: sum(irate(<<.Series>>{<<.LabelMatchers>>}[1m])) by (<<.GroupBy>>)
Ta tạo custom rule để biến metrics mqtt_publish_received trở thành tổng số message nhận được mỗi giây trên mỗi node sum(irate(<<.Series>>{<<.LabelMatchers>>}[1m])) by (<<.GroupBy>>)
Sau đó khởi tạo prometheus-adapter
helm install prom-adap . -f values.yaml
Tạo autoscale và kiểm tra
apiVersion: autoscaling/v2beta1
kind: HorizontalPodAutoscaler
metadata:
  name: vernemq-autoscaler
spec:
  scaleTargetRef:
    # point the HPA at the sample application
    # you created above
    apiVersion: apps/v1
    kind: StatefulSet
    name: myvernemq
  # autoscale between 1 and 10 replicas
  minReplicas: 1
  maxReplicas: 10
  metrics:
  # use a "Pods" metric, which takes the average of the
  # given metric across all pods controlled by the autoscaling target
  - type: Pods
    pods:
      # use the metric that you used above: pods/http_requests
      metricName: mqtt_publish_received
      # target 500 milli-requests per second,
      # which is 1 request every two seconds
      targetAverageValue: 60m
Ban đầu khi không chạy stress test:
NAME                 REFERENCE               TARGETS   MINPODS   MAXPODS   REPLICAS   AGE
vernemq-autoscaler   StatefulSet/myvernemq   0/60m     1         10        1          3h49m


+----------------------------------------------------------------+-------+
|                              Node                              |Running|
+----------------------------------------------------------------+-------+
|VerneMQ@myvernemq-0.myvernemq-headless.default.svc.cluster.local| true  |
Khi tải tăng lên
+----------------------------------------------------------------+-------+
|                              Node                              |Running|
+----------------------------------------------------------------+-------+
|VerneMQ@myvernemq-0.myvernemq-headless.default.svc.cluster.local| true  |
|VerneMQ@myvernemq-1.myvernemq-headless.default.svc.cluster.local| true  |
+----------------------------------------------------------------+-------+

vernemq-autoscaler   StatefulSet/myvernemq   22m/60m   1         10        3          3h8m
NAME                 REFERENCE               TARGETS   MINPODS   MAXPODS   REPLICAS   AGE
vernemq-autoscaler   StatefulSet/myvernemq   22m/60m   1         10        3          3h8m
Tiếp tục tăng:
vernemq-autoscaler   StatefulSet/myvernemq   266m/60m   1         10        4          146m
NAME                 REFERENCE               TARGETS    MINPODS   MAXPODS   REPLICAS   AGE
vernemq-autoscaler   StatefulSet/myvernemq   266m/60m   1         10        4          146m
NAME                 REFERENCE               TARGETS    MINPODS   MAXPODS   REPLICAS   AGE
vernemq-autoscaler   StatefulSet/myvernemq   266m/60m   1         10        4          146m
NAME                 REFERENCE               TARGETS    MINPODS   MAXPODS   REPLICAS   AGE
vernemq-autoscaler   StatefulSet/myvernemq   800m/60m   1         10        5          146m


+----------------------------------------------------------------+-------+
|                              Node                              |Running|
+----------------------------------------------------------------+-------+
|VerneMQ@myvernemq-0.myvernemq-headless.default.svc.cluster.local| true  |
|VerneMQ@myvernemq-1.myvernemq-headless.default.svc.cluster.local| true  |
|VerneMQ@myvernemq-2.myvernemq-headless.default.svc.cluster.local| true  |
|VerneMQ@myvernemq-3.myvernemq-headless.default.svc.cluster.local| true  |
|VerneMQ@myvernemq-4.myvernemq-headless.default.svc.cluster.local| true  |
+----------------------------------------------------------------+-------+
Sau cùng:
+----------------------------------------------------------------+-------+
|                              Node                              |Running|
+----------------------------------------------------------------+-------+
|VerneMQ@myvernemq-0.myvernemq-headless.default.svc.cluster.local| true  |
|VerneMQ@myvernemq-1.myvernemq-headless.default.svc.cluster.local| true  |
|VerneMQ@myvernemq-2.myvernemq-headless.default.svc.cluster.local| true  |
|VerneMQ@myvernemq-3.myvernemq-headless.default.svc.cluster.local| true  |
|VerneMQ@myvernemq-4.myvernemq-headless.default.svc.cluster.local| true  |
|VerneMQ@myvernemq-5.myvernemq-headless.default.svc.cluster.local| true  |
|VerneMQ@myvernemq-6.myvernemq-headless.default.svc.cluster.local| true  |
|VerneMQ@myvernemq-7.myvernemq-headless.default.svc.cluster.local| true  |
|VerneMQ@myvernemq-8.myvernemq-headless.default.svc.cluster.local| true  |
|VerneMQ@myvernemq-9.myvernemq-headless.default.svc.cluster.local| true  |
+----------------------------------------------------------------+-------+

NAME                 REFERENCE               TARGETS   MINPODS   MAXPODS   REPLICAS   AGE
vernemq-autoscaler   StatefulSet/myvernemq   11m/60m   1         10        10         154m
NAME                 REFERENCE               TARGETS   MINPODS   MAXPODS   REPLICAS   AGE
vernemq-autoscaler   StatefulSet/myvernemq   22m/60m   1         10        10         154m


Ta theo dõi vào TARGETS có thể thấy pod được scale khi request đến nhiều hơn, và scale vào khi ít request đi.
References:
[1] - https://github.com/helm/charts/tree/master/stable/prometheus-operator#prometheusioscrape
[2] - https://docs.vernemq.com/installation/accepting-the-vernemq-eula